Skip to content
Menu
Blythe Adamson, PhD, MPH
  • Infectious Economics LLC
  • Publications
    • Manuscripts
    • Abstracts
    • Other Articles
    • Speaking
  • Courses
    • Short Course
    • Methods
    • Research
    • Resources
  • Media
    • Press
    • Speaking
  • About
Blythe Adamson, PhD, MPH
November 28, 2017March 8, 2023

Predicting Drug Uptake with Google Trends

Figure 1. PrEP Prediction Model. Circles = cumulative number of persons initiating PrEP (Source: Mera 2017); blue = prediction; red and orange = validation.

It is hard for us to know exactly how many people take the drug Truvada (TDF/FTC) to prevent versus treat HIV. Word is spreading through communities about this daily pill to the reduce risk of infection, and as people become informed the number of users is increasing. Can Google help us predict this uptake?

Building on the suspicion in my previous post that the trends in Google searches for “HIV prep” matches perfectly with the rate of Truvada uptake, here we explore the potential validity of using Google Trends to predict future uptake of the drug. After comparing the fit of different combinations of parameters, this simple linear regression model seemed sufficient:

N_{t} =\alpha+\beta_1 Google_t +\beta_2 time +\beta_3 time^2+\beta_4 Google_t \ast time

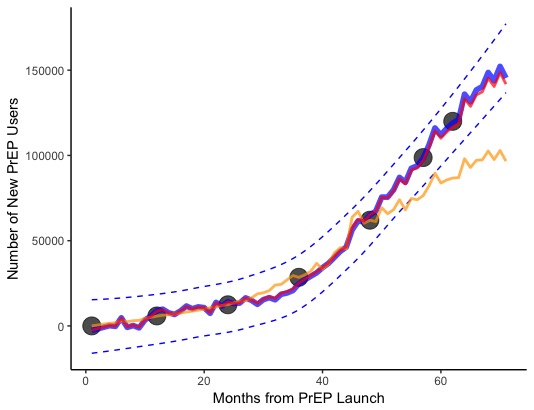
Here the outcome N is the cumulative number of people initiating PrEP in month t based on the popularity of Google searches as score Google(t). To assess the validity of using Google Trends to predict the future number of people on PrEP, we can fit the model based on users from 2012-2015 (orange) or 2012-2016 (red) so we can see how closely the predictions hit to the actual number of users in 2016 and 2017.

fit <- lm(prep ~ trend + time + time^2 + trend*time, data=data)
hat <- predict(fit, newdata = data, interval = "prediction")
Figure 2. Residuals from model fit

Next time

Next time I try this I will spend a little more time fitting a poison generalized linear model, since the outcome is a count of persons bounded between zero and infinity. What would really make this awesome is monthly data from Gilead to use as the outcome instead of the yearly totals pulled from the abstract of Mera et al.

Reference: Mera R et al. Changes in Truvada for HIV pre-exposure prophylaxis utilization in the USA: 2012-2016. 9th International AIDS Society Conference on HIV Science, Paris, July 2017.

SaveSave

Share this:

  • Click to share on X (Opens in new window) X
  • Click to share on Facebook (Opens in new window) Facebook

Related

Leave a Reply Cancel reply

Your email address will not be published. Required fields are marked *

Top Posts & Pages

  • The Last of Us Epidemiologists:  Fungal Zombies, Public Health, and the Fight to Survive
    The Last of Us Epidemiologists: Fungal Zombies, Public Health, and the Fight to Survive
  • Tools for Reproducible Real-World Data Analysis
    Tools for Reproducible Real-World Data Analysis
  • Fall 2020 Scientific Speaking
    Fall 2020 Scientific Speaking
  • Propensity Scores
    Propensity Scores
  • CHEAT SHEET: Cancer Immunotherapy
    CHEAT SHEET: Cancer Immunotherapy
My Tweets
Twitter

Top Posts & Pages

  • The Last of Us Epidemiologists:  Fungal Zombies, Public Health, and the Fight to Survive
    The Last of Us Epidemiologists: Fungal Zombies, Public Health, and the Fight to Survive
  • Tools for Reproducible Real-World Data Analysis
    Tools for Reproducible Real-World Data Analysis
  • Fall 2020 Scientific Speaking
    Fall 2020 Scientific Speaking
  • Propensity Scores
    Propensity Scores
  • CHEAT SHEET: Cancer Immunotherapy
    CHEAT SHEET: Cancer Immunotherapy
My Tweets
©2025 Blythe Adamson, PhD, MPH | Powered by WordPress and Superb Themes!
 

Loading Comments...